 Back to the news list
The prospect of a 2nd coronavirus wave and consequent demand slump is putting substantial downward pressure on crudes in Europe. Differentials are weakening as most refineries run their distillation units at least 15-20% lower than the nominal capacity and might drop even lower if some of them decide to go into unplanned hibernation during the wintertime. Yet if there is one major trend that has defied the weak buying market of 2020 it is that of expensive Urals, in fact the most expensive the market has seen in the 21st century. Prompted to comply with the terms of the OPEC+ agreement and simultaneously urged by the federal Finance Ministry to keep Urals prices at a level acceptable enough for the state budget (breakeven of $42.4 per barrel), Russian oil companies have gone the only way imaginable – cutting both production and exports.

Graph 1. Urals Mediterranean and Urals Rotterdam (Baltic) vs Dated Brent in 2020 (USD per barrel).
If one is to look at this year’s Urals differentials, bar one remarkably volatile price period in April-May, throughout 2020 Urals has been on par with Dated Brent, if not higher. At the time of this writing (October 29, 2020) Urals Med was priced around +0.75 per barrel above Dated, whilst Urals Rotterdam was at +0.50 per barrel. For more than three consecutive months (May – July) Urals in the Baltics was trading above Dated, an unprecedented feat in modern history. For a little bit of chronological reference, let’s take a look at how Brent-Urals spreads have evolved over the past years, especially in view of the OPEC+ production curtailments from 2018 onwards. One can see that the Baltics was always discounted to the Mediterranean – a consequence of the mugh higher volume being pumped from Primorsk and Ust-Luga.

Source: Platts.
Perhaps surprisingly, one of the corollaries of Russia cutting its output, be it with the first phase of OPEC+ cuts agreed on in Vienna late 2017 or the drastic curtailment from April 2020, was the narrowing of spreads between the Baltic and the Mediterranean. The Mediterranean market for Urals is in and of itself rather squeezed – a significant portion of the cargoes go into refineries owned by Russian companies and only a fraction of the available monthly allocation makes it into third-party refineries. Provided there are no major market shocks or high-impact refinery turnarounds, basically every month would see 1-2 cargoes going to LUKOIL’s refineries in Romania and Bulgaria (vessels moving to Constanta and Burgas), the Turkish TUPRAS taking a similar quantity and Italian refineries bringing in a couple.

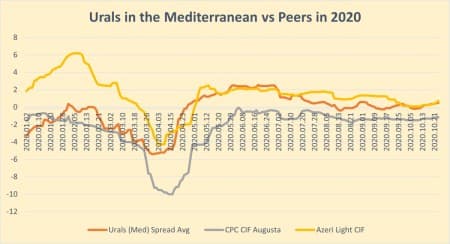
Graph 2. Urals Med Quotes Against Mediterranean Peers in 2020 (USD per barrel).
The higher level of coordination is in many ways the reflection of the Russian Energy Ministry’s increased clout in terms of ensuring OPEC+ compliance and the overwhelming preponderance of Russian firms in the country’s energy sector. Other oil producers active in the Mediterranean region, be it Kazakhstan with its flagship CPC stream or Azerbaijan with its streams of BTC and Azeri Light, are much more reliant on other (foreign) companies to produce their oil and hence found themselves more constrained in mandating production cuts. In Russia, however, the Energy Ministry calculated the expected production cuts on a pro-rata basis, taking the companies’ market share as the basis of their commitment (i.e. the prime Russian oil producer Rosneft has cut the most, namely 34%). It should be of little surprise that the oil companies, including non-state-owned ones, agreed to adhere to the deal.

Graph 3. Urals Exports by Loading Port (Primorsk, Ust-Luga in Baltics/ Novorossiysk in the Mediterranean) in 2017-2020 (‘000 barrels per day).
Talking of Russia’s OPEC+ commitment discipline, Moscow’s commitment to the stabilization of markets has exceeded analyst’s expectations. As opposed to previous OPEC+ deals, this time the Kremlin did not ask for wind-down periods of several months and managed to stick to its pledges despite their drastic nature. In January-April 2020 Russia’s total crude production hovered around 11.25-11.27 mbpd and it was within this period (especially in late March, the lowpoint of market sentiment in H1 2020) that Urals piled up negative records, with the Med Urals differential dropping as low as -5.40 to Dated Brent, all this at a time when oil prices have slipped below 20 per barrel. Urals in the Baltics fared no better, with its differential against Dated Brent declining to a 21st century low point of -4.65.
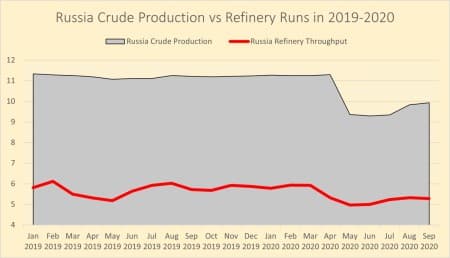
From April to May 2020, however, Russia has managed to decrease its production by almost 2mbpd (from 11.29mbpd to 9.358mbpd) and has kept its output at the required level until August (see Graph 4). Despite the unprecedented commitment Russia still did not reach a 100% compliance rate, which did not become a more widely publicized media issue largely thanks to the murky statistics of crude/condensate production. The official numbers that the Russian Energy Ministry issues are a sum of crude and condensate produced, moreover, denominated in metric tons. Hence, deciphering the exact barrel per day production rate of crude exclusively (as condensate has been exempted from the OPEC+ production cuts) is a rather challenging task.
The recent OPEC+ joint ministerial committee (JMMC) on October 19 has provided a bit of an insight into the current picture of Russia’s underperforming its quotas, generally assumed to be somewhere around the 96-97% mark. In terms of crude production without condensate, Russia’s OPEC+ crude quota was set at 8.49mbpd in May-July, moving up to 8.99mbpd in August-December 2020 (and to 9.5mbpd from there onwards all the way to April 2022). Energy Minister Alexander Novak claimed that Russia, as a responsible participant to OPEC+, has “always fulfilled its commitment at close to 100%” and seemingly other members do not seem to have an issue with that. Judging by secondary output reports, Russia has slightly overproduced the entire May-July period by some 70-80kbpd, then underperformed August and went back into overproduction in September.

Graph 4. Russia Crude Production vs Refinery Throughput in 2019-2020 (million barrels per day).
lves of the plummeting crude prices and Urals differentials, Chinese have bought an all-time high of then ultra-cheap Urals in the April loading programme (a monthly total of 25 cargoes with aggregate loaded volume around 24 MMbbls). Following June 2020, however, Urals has disappeared completely as a purchasable grade from the Chinese refiners’, July-September was completely empty and this October saw the first cargo to be sold to Asia Pacific. Crude supplies to India was a swiftly increasing business in 2019, now there’s just one Suezmax cargo per quarter. Transatlantic deliveries to the United States have plummeted tenfold, this year has witnessed merely 4 vessels arriving to the US Gulf Coast (totaling 1.7 MMbbls) whilst 2019 saw roughly 35 cargoes to a total of 18 MMbbls.
In addition to all the factors stated above, November has brought about an extra layer of Urals scarcity, ensuring that the Russian flagship grade’s differentials are going to stay at least as high as they are now. First and foremost, one of the Baltic ports (Ust-Luga) is going into maintenance on November 07-16 with no availability to load cargoes, thereby sending the preliminary November loading program as low as 1.2mbpd. This “controlled dearth” of crude has also mitigated the bearishness of Urals forwards – even in a January 2021 horizon both Mediterranean and Baltic Urals are equal to higher than the Dated Brent CFD. Hence, there is every reason to believe that Urals is to remain expensive at least until the end of the year, to the extent that the historically high differentials might become the new norm.
Không thể sao chép